Einblick is a new and trending analytics tool that gives you insight into your data through all three types of Analytics: Descriptive, Predictive and Prescriptive. Einblick helps provide insights to make better decisions about their marketing campaigns, sales strategies or even hiring new employees.
Einblick is an MIT and Brown Universities spin-off.
Their value proposition is bold.
Einblick is the world’s first visual data computing platform to provide a collaborative and faster approach to take action through data.
And the interest in the tool has been growing steadily

What is Descriptive Analytics?
Descriptive Analytics is the ability to look at past data and understand what has happened. This can include understanding customer behaviour, sales trends or even website traffic.
What is Predictive Analytics?
Predictive Analytics is the ability to predict what might happen in the future. For example, whether or not your customers are likely to buy a new product, how much they may spend on average and even if they will open your emails!
What is Prescriptive Analytics
Prescriptive analytics is the next step up from predictive analytics. Predictive analytics tells what you should do. It can provide recommendations on actions to take to achieve the desired outcome.
How Einblick combines all three types of analytics into one tool
Einblick is a data analysis tool that enables users to combine descriptive, predictive, and prescriptive analytics into one interface. This makes it easy for users to get a comprehensive view of their data and make better decisions. Einblick also offers a variety of features that make it easy to use for both experts and beginners. These features include a drag-and-drop interface, automatic data preparation, and interactive visualizations. Einblick is also fast and scalable, making it ideal for large datasets.
Einblick is available in the cloud. It is helpful for businesses of all sizes and is good for both experts and beginners. Einblick offers a free trial so that companies can try it out before deciding if it’s the right tool for them. For more information, visit Einblick’s website.
Benefits of using advanced analytics to analyze data from your company’s historical records and future trends
There are several benefits to using predictive and prescriptive analytics to analyze data from your company’s historical records and future trends. Predictive analytics can help you better understand your customers and their behaviour, predict future trends and identify growth opportunities. It can also help you make more informed decisions about business strategy, product development, and marketing.
Predictive analytics is a powerful tool to help businesses optimize their operations and improve their bottom line. Companies need to stay ahead of the curve and capitalize on new opportunities.
Starting with Einblick: Visual Guide
I used Einblick for the very first time before writing this article.
Einblick offers free accounts up to 5 workspaces and 100MB of data. It is not a lot, but it is enough to start.
I had some hiccups while creating my account and got some errors. I tried again after a couple of days, and everything went well.

Einblick Interface
The user interface is neat and straightforward.

Different projects and spaces are on the left-hand side as well as data sets, operators and schedules.

Loading Data
There aren’t many connectors in Einblick at the moment. However, in the upload data interface, you will find CSV, SQL, Amazon S3 and Google sheets.

There are datasets preloaded into Einblick that you can use but I uploaded a simple Hotel reservations dataset from my course “Introduction to Data Analytics”.
The data loaded fast, and the fields were parsed correctly.

Analyzing Data in Einblick
To start exploring data, you will need to create a workspace. This is a matter of two clicks.

Once created, you will be presented with the following interface:
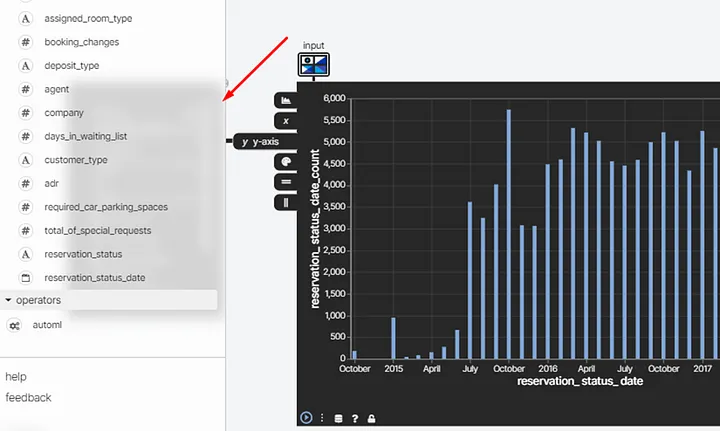
Open the dropdown data frames, and you find your dataset. Once selected, you see all the fields.

Refreshing Data in Einblick
The menu schedules allow setting refreshing data jobs.

Descriptive Analysis with Einblick
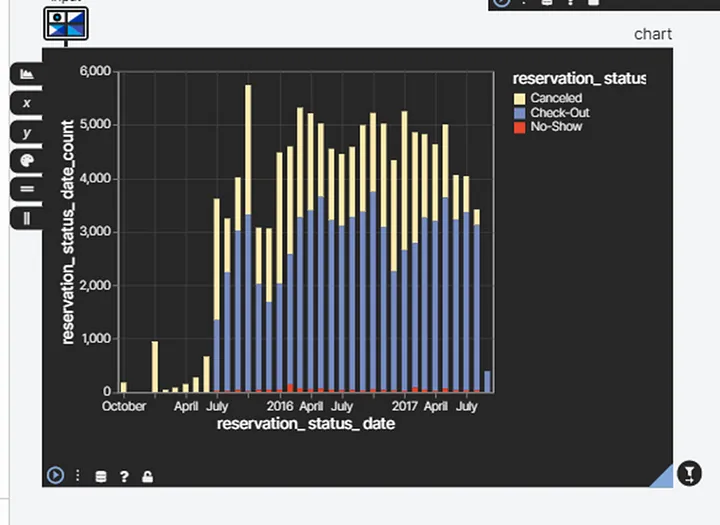
Data exploration is simple. I dragged the hotel to the canvas et Voila. A chart was plotted in no time. Then I changed the Y-axis into the metric “cancellations” and altered the aggregation.

Breakdowns are also easy

Custom Columns
I tried to create a custom column, but I couldn’t find how to do it (even after googling it).
Advanced Analytics with Einblick
Einnblick offers several interesting tools to conduct advanced analytics on datasets.
Those are in the left sidebar under operators.

Joins
Joining datasets seems easy. Select the datasets, then the keys, and merge the dataset.

SQL
Creating a SQL statement and pulling data from a data connector is possible.
I couldn’t figure out how to run a SQL statement on the current dataset.
Python
A python console module creates custom data frames using input data and Python expressions.

My Python is not the best, so I will let the Data Science community report on this one 😊
Correlations
It is effortless and quick to find correlations between your data fields.

You can even select all your fields to find possible correlations.

Machine Learning ML
The ML operator seems to be powerful. It is simple to select fields and train a model on different variables and different methods.
Collaboration on Einblick
There are some exciting collaboration features in Einbick
Go live
I couldn’t figure out this one entirely. I thought it was a recording that you can share, but it seems more screen sharing.

Sharing
You can share Canvas with other users.

Navigation and Stability
A navigation map in the bottom right corner helps find charts in the canvas. Very useful.

Einblick is web-based, and sometimes there are disconnections and errors.

When a chart is close to the sidebar, part of it is not showing

Einblick Price
Einblick is Free to get started with limited data and workspaces
Einblick had a launch offer of $45 per user month when billed yearly when writing this article.
They also have tailored enterprise packages.

Conclusion
I didn’t spend much time using Einblick but I managed to put together quite a few analyses. That speaks about a relatively easy learning curve. I liked the tool’s simplicity, and I think it is good to explore data and share discoveries with your team. Data Analysts, Scientists and teams can save time and materialize quick insights with Einblick.
Have you tried Einblick? What is your take?


