“We need more data analysts” or “we have too many data analysts.” Where do you stand?.
“What are our analyst’s value $?” you might ask to be able to take one side.
That is a question that thousands of companies make themselves every day. But unfortunately, the truth is that finding the ROI of Data & Analytics is rarely straightforward and requires quite a lot of thinking before reporting numbers with confidence.
But first things first…
What is ROI?
Return on Investment (ROI) is a famous metric that evaluates how well an investment has performed.
It is helpful because it allows you to compare different types of investments and rank them.
ROI Formula
ROI or Return on Investment is calculated as:
(Net Profit / Investment)*100
ROI is always represented as a ratio or percentage.

What is Data& Analytics ROI?
Simply put is the tangible contribution of an Analytics unit (or a particular task) to a business.
The Problem with Data & Analytics ROI
As a supporting function, analytics (particularly descriptive) rarely directly impact business performance like other activities, such as marketing.
A real life example:
An analysis points to low CLV (Customer Lifecycle Value).
Commercial and analytics teams pinpoint some potential issues.
Then the rest of the teams take action and put solutions in motion .
In the end, there is a change. But can you attribute the shift entirely to the initial analysis? No.

However, there are proxies to quantify the ROI of Data & Analytics and its contribution to bottom line.
5 Ways to Measure the ROI of Data & Analytics
1-Adoption
If people don’t use your products/services, you will never see a real ROI on your Data & Analytics (or Digital) investments.
Method: This method consistently measures how your people use data products and services.
Today’s software and SaaS provide usage stats. You will need to attribute a monetary value to each of the visits/users. This can be tricky, but a viable way to do these is to use the price of the software and company to your budget and the number if you so you will assign a value per user.
Example: You have business intelligence applications running reports. So you assign a value per active user** to calculate the return of your reporting suite.
Formula: ((Value per active user * Users)/Cost of BI App)*100

*Here, you can account for things like productivity (hours saved per person) or refer to point two to define a value.
2-Data-Driven Improvements
A data-driven improvement is a change triggered by a report, analysis, or insight.
Data-driven initiatives require a little more work because you need to follow the process to gauge change results.
Take a look at the GIDAR Analytics Framework for a simple process on triggering and measuring change.
Method: Establish a two-way communication channel that allows you to measure inbound and outbound propositions.
Then follow up the modifications and measure again and account for the differences.
Example
Inbound initiatives: The sales team is aware of a decrease in sales in the last two quarters. They suspect that new competitors are stealing market share. So you run a competitor analysis and come back with a list of suggestions to get the market before. The result is a +6% growth.
Outbound Initiatives: Your team detects that three of your retail locations are consistently running of stock instead of the others. Operations start shifting supplies, and it results in +12% more sales.
Formula: ((Revenue of data-driven initiatives)/Cost of Analysis**)*100

**Hours invested*cost per hour. Or the price of the analysis if it is external.
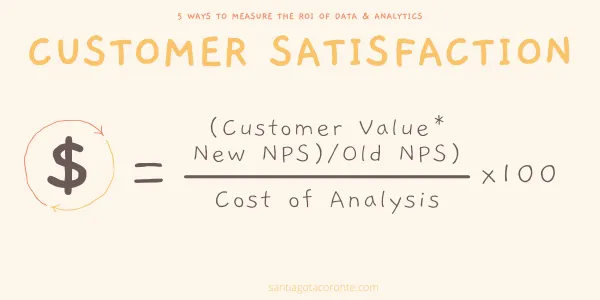
3-Customer Satisfaction
Similar to Data-Driven initiatives, tracking the impact of customer analysis and recommendations can return a good approximation to our market research and customer satisfaction efforts.
Method: Using a model like the NPS of Bain & Company together with customer value, attaching a dollar value to each incremental point on customer satisfaction is possible.

Formula: ((Customer Value* New NPS)/Old NPS)/(Cost of Analysis**)*100

**Hours invested*cost per hour. Or the price of the analysis if it is external.
4-Product Increments
Most companies nowadays work with products.
If you analyze physical or digital product features, you will likely have insights on what things you need to add or change.
Method: Retrieving the financial performance of product increments can give you a sense of what a new feature or version can return to the analysis.
Example: Your company launches a bot as a part of the customer service, but it is not very successful in fixing client problems. Data & Analytics team analyzes the chats and figure out a new taxonomy. The latest version works better, resulting in 10% fewer calls.
Formula: ((product increment revenue)/Cost of Analysis**)*100

5-Data Maturity
Several models assess how data-savvy your organization is. Some agencies can do it for you, or you can also create your own, based on your company goals.

With a data maturity assessment, you can measure the ROI of Data & Analytics at a broader level.
Method: Run an assessment of data maturity throughout your organization. Then assign a dollar value to each level of maturity in the scale. The question to answer here is how much is a more or less data-savvy employee worth.
Formula: ((Employees maturity * Maturity Value)/Data & Analytics Team Cost)*100

Another way of calculating Data & Analytics ROI
Advanced analytics and data science are ways of combining more variables and reaching more accurate results. Nevertheless, it is an excellent exercise to start with diagnostics before building a model.
Conclusion
Calculating the ROI of Data & Analytics is challenging. None of the suggested methods is perfect, and some of them might work better than others in your context.
However, they give us an approximation to the $ impact of your Data & Analytics efforts.
With time, you will refine the data collection and provide a more accurate value.


